How GATOM works
Most metabolic processes have been researched quite well. For instance, you can find a profound description of glycolysis – the conversion of glucose into pyruvic acid to produce energy – in any biochemistry textbook. But living organisms don’t always follow predetermined paths. Errors are common in cell processes, which in particular may lead to autoimmune diseases, degenerative processes, and cancer. It’s especially important to study such processes in immunology. If you know what caused the inflammation or a tumor, you can also learn how to deal with it.
The tool developed by scientists from ITMO University works as follows: a researcher (biologist, immunologist, doctor, or a bioinformatics specialist) uploads analytical data on, for example, a tumor tissue sample. This can be information on what kinds of metabolites are present in the tissue and which genes are active in this or that process. Then, the program compares initial data with the databases KEGG and Rhea, which contain descriptions of most standard biological processes. As a result, the software produces a graph that depicts how substances undergo transformations during biochemical reactions. Plus, the algorithm calculates which metabolites and genes to check:
“The program highlights the most relevant reactions using bright colors or bigger sizes. The graph’s vertices are metabolites (biochemical substances) and lines between them (edges) represent reactions that, in their turn, correspond to specific genes. It’s actually a rather nontrivial task – in a big graph, the algorithm highlights a small subgraph in which the changes are especially noticeable. Therefore, the researcher sees both the bigger picture and its most crucial parts: the way a gene or a metabolite changes and how this or that reaction is related to others. This helps interpret data more precisely and better understand these processes, as well as come up with hypotheses on how to influence them,” says Alexey Sergushichev, head of ITMO’s Laboratory of Genomic Diversity and the frontier lab Computational Methods for Systems Biology.

Alexey Sergushichev. Credit: ITMO.NEWS.
Thanks to the proposed computation method, the scientists have managed to find connections between Alzheimer’s disease and an error in the gene TREM2, as well as prove that you can slow down the growth of a tumor by slowing down metabolic processes in cancerous cells. According to the project’s authors, these are just a couple of examples of ways to apply the program.
New features
The program itself was developed quite a while ago, in 2016. But, the researchers admit, even though it was able to solve its main task and analyze biochemical processes in cells, it wasn’t always easy to interpret the resulting graph. The thing is, it was substances that were initially represented by vertices and, given that metabolites can undergo transformations numerous times, this complicated the interpretation process. Now, the developers suggest a new approach that focuses on atoms of substances, as they are easier to follow:
“We realized that it’s actually better to focus the graph on atoms rather than substances. We know for sure that one atom turns into another when there’s a reaction, so there’s no ambiguity like with substances. The way atoms transform always corresponds to the sequence of reactions. It’s linear and fits our understanding of standard metabolic paths. That’s what helped structure our graph better,” explains Alexey Sergushichev.
Another important addition is the opportunity to work with lipidomic data. As the scientists explain, lipidomics is a quite new but rapidly growing field and there are few programs that are capable of analyzing metabolic lipid processes. However, the reactions in lipids are already well described in Rhea, which also became part of the GATOM algorithm.
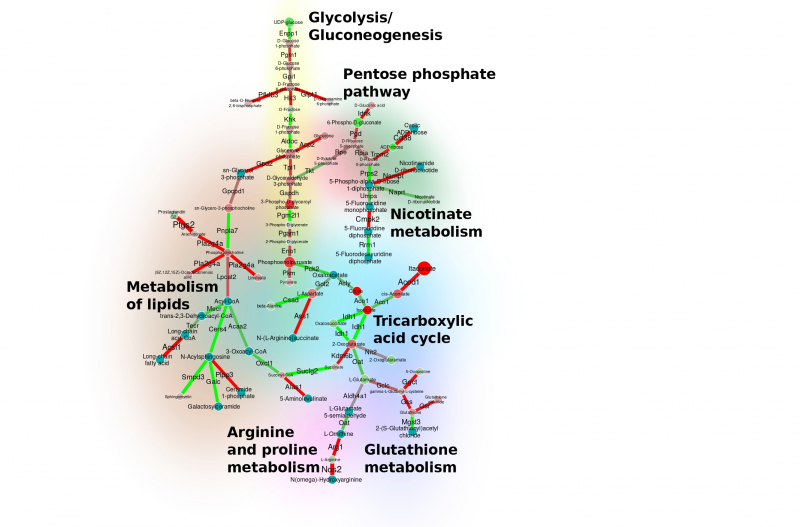
The graph for glycolysis and glycogenesis. Image courtesy of the project’s authors.
Future plans
GATOM used to be available only as a web service, but the project authors also compiled a package for the R programming language that can be freely downloaded on GitHub. All of the program’s pipelines are also available for use and modification so that users would be able to adapt the algorithm for their needs. The original tool only allows users to pick one of four living organisms: a mouse, a human, a fungus (yeast), or a plant (arabidopsis). However, thanks to the open-source policy, users can modify the pipeline for any organism.
As of now, the algorithm works for comparing a biological state of interest with a control state (e.g., the comparison of diseased and healthy cells), but in the future the developers plan to add the opportunity to compare several states simultaneously. This feature is already developed but it works too slowly as a web service due to the higher computing capacity required, so the current goal is to improve the algorithm and make it faster and more efficient.
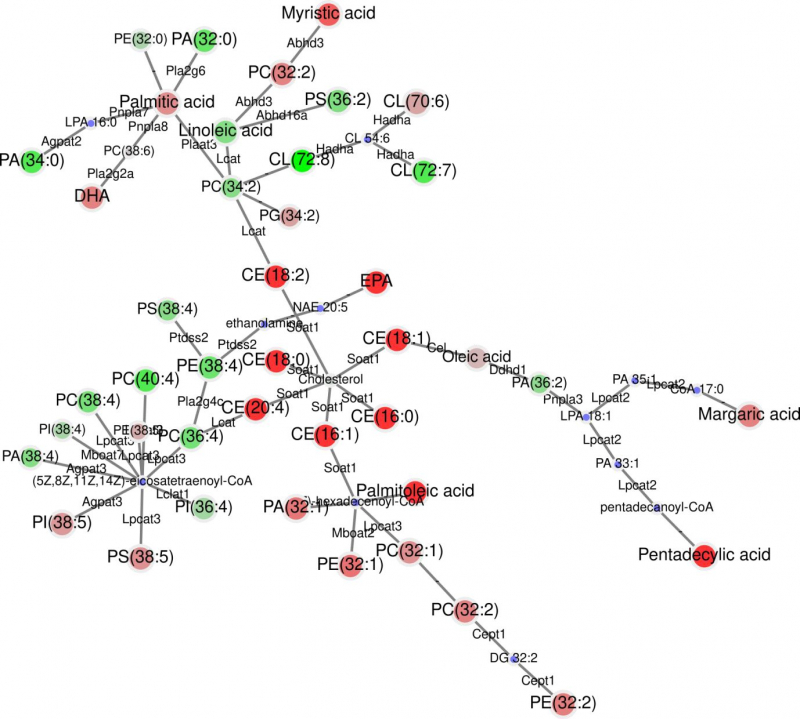
The comparision of lipidomic processes in mice with normal and high-fat diets. Image courtesy of the project’s authors.
This research was implemented with the support of ITMO’s 2030 Development Strategy as part of the activities of the frontier lab Computational Methods for Systems Biology.
Reference: Mariia Emelianova, Anastasiia Gainullina, Nikolay Poperechnyi, Alexander Loboda, Maxim Artyomov, Alexey Sergushichev. Shiny GATOM: omics-based identification of regulated metabolic modules in atom transition networks (Nucleic Acids Research, 2022).