Novel applications of computer vision
According to forecasts by the MarketsandMarkets market research company, the market for computer vision systems is about to grow from $16 billion to over $50 billion by 2026. The technology is currently used not only in production, but also in our daily lives, for instance, in face recognition systems for public transport, which will help identify free riders and monitor the use of social transport cards, as well as the work of drivers and conductors. The data for such systems will be provided by the growing number of CCTV cameras present in every major city.
At ITMO, security cameras are used mainly for their primary designation, however, according to the team at the Learning Analytics Center, they hold a bigger potential. For instance, they can be used to optimize various processes inside the university – and this is the idea behind the Computer Vision project.
One of the primary uses of the new system is managing the load of study rooms. A conventional way to check whether a room is free would be to check the class schedule, however it is not always accurate: some classes are held online or are substituted with personal assignments, which means that a room that is marked as occupied in the schedule can actually be free. The system, relying on data from cameras, can quickly determine whether the information in the schedule is accurate and identify free rooms that can be used for other activities. This is particularly useful during peak activity hours, when there is a shortage of rooms. Additionally, this means that the staff of the Center for Educational Management and Quality Assurance now don’t have to personally check every available room, relying instead on the system of cameras.
Students, too, can benefit from this data, which they can now access via the my.itmo app. The feature is now only available for the main campus and covers several public spaces, including the cafeteria, two coworking spaces, and the orange classroom. This makes it easy to organize meetings or study groups at the least crowded spaces.
“Dmitry Ioksha, a member of the Learning Analytics team, came up with this idea for the ITMO.FUTURE contest of student initiatives. He wanted to develop a feature for the student app that will track vacant study rooms. However, as the project outgrew the capacities of the contest, our whole team joined its development. We saw that it could be used not only as a feature in the student app, but also as a tool to optimize the university’s business processes and assist the administrative staff,” shares Alexey Serdiukov, the head of the Computer Vision project.
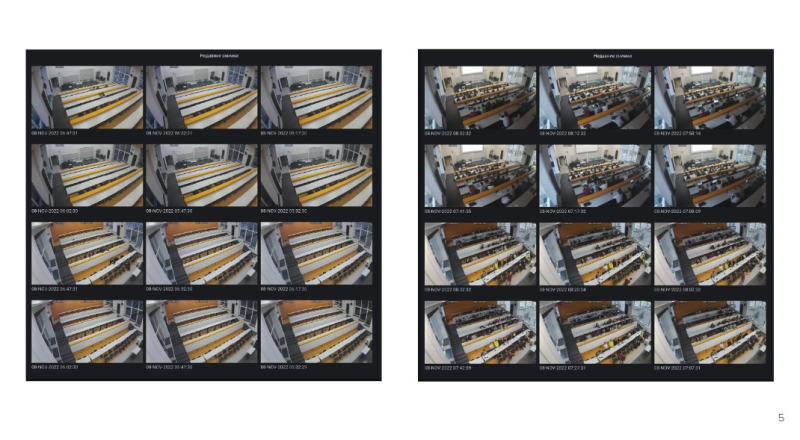
Images processed by the neural network: an empty classroom on the left and an occupied one on the right. Image courtesy of Alexey Serdiukov
The inner workings of the system
The project is based on an object-recognition neural network YOLO (You Only Look Once) that was additionally trained on data from the university’s cameras. Currently, the system processes information provided by 218 cameras at over 50 locations on the Kronverksky Pr. and Lomonosova St. campuses.
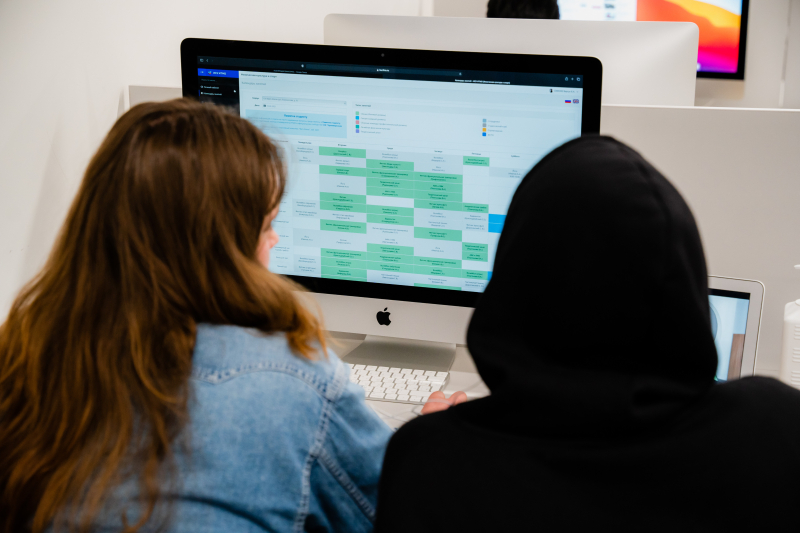
In order to process the information, it is first broadcasted to a server, where every five seconds a random shot is analyzed by the AI. The system detects the amount of people in the shot and their locations and uploads the results to a storage, where they are available in the form of tables, plots, and shots presented on an interactive panel to the staff of the Center for Educational Management and Quality Assurance. For instance, this makes it possible to check the actual load of a specific room at a given time and compare it to the one planned in the schedule.
“We’ve been working on the project for about ten months. By far the greatest challenge was integrating the cameras into our system and building a platform that will collect the data, analyze it, and store the results in a database. In the summer, we showed our dashboard to the staff of the Center for Educational Management and Quality Assurance and started tweaking it to meet their demands. In September, they were able to test the system in practice for the first time. It is worth pointing out that this is a strictly analytical system. I want it to be used to optimize the academic processes, not to issue penalties to students,” explains Alexey Serdiukov.
By analyzing the data, the new system can tell how many classes were held, how many students attended them, how long they usually last, as well as how often a room is occupied outside of schedule, how students use coworking spaces and cafeterias, and which areas are the most popular. All of this information can be organized by room, lecturer, subject, student group, or faculty, which will help identify where the current workflow isn’t functioning well and what can be done to optimize it.
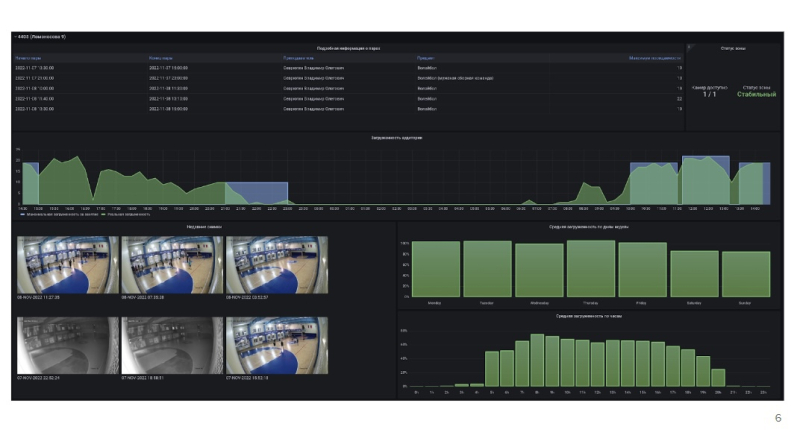
The dashboard of the new platform. Image courtesy of Alexey Serdiukov
“Based on our data, we can already tell that in 90% of cases two consecutive classes in one subject finish earlier than planned, which may be an indicator that we need to review this kind of schedule. This is an illustration of the data-driven university approach adopted by the Learning Analytics Center. We believe that data can be used to back up both the decision-making process and the evaluation of the efficiency of these decisions,” adds Alexey Serdiukov.
The team behind the project
Apart from Alexey Serdiukov, who heads the project, the team includes other specialists of the Learning Analytics Center: Edem Ibraimov, a lead engineer and system architecture expert; Daniil Masalski and Dmitry Ioksha, specialists in machine learning, AI, and analytics; and Michil Egorov, a backend developer and machine learning specialist. Among the project’s contributors are also students of the Computer Vision track (within the Infocommunications and Digital Media Master’s program) launched in 2022 by ITMO in collaboration with Napoleon IT.
“Our team’s main goal is to develop useful data-driven solutions that will produce feasible results for the university. This approach is widely used in the industry, but so far only a handful of universities are using it in the academic process. However, we can’t just copy the data-driven practices used in the business world, so our team has the chance to test and implement some very daring hypotheses. Actually, this is how our strong team of engineers was born – we are working with computer vision and are determined not to develop another Big Brother. In the course of ten months, we have solved a multitude of complex and unconventional tasks and developed our own scalable architectural solution that can be expanded with microservices. Some of our solutions are unique on the market, suggesting innovative approaches to various problems, which is why one of our strategic objectives is entering the international market,” says Svyatoslav Oreshin, the head of the Learning Analytics Center.
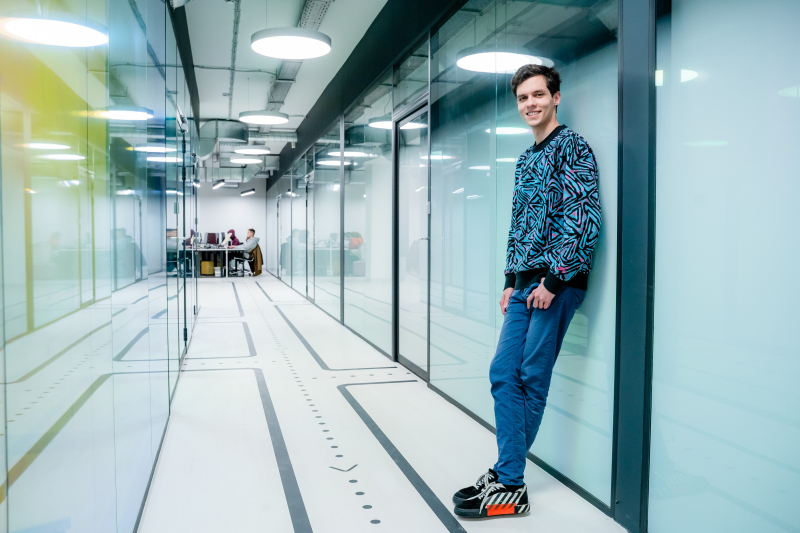
Svyatoslav Oreshin. Photo by ITMO.NEWS
What comes next
Even more solutions by the center for various applications are now at the stage of technical prototypes. For instance, there is an emotion recognition system for closeup videos (such as those in Zoom) and security cameras that will help evaluate student and lecturer engagement during classes and even potentially introduce the best teaching practices in every class.
Another prototype currently in development is a software that will analyze the workload of the Student Services Office in different hours to help optimize the number of employees needed at a specific time of day.
The team is also thinking about bringing their prototypes to the market.
“We believe that one of the possible directions we can take is early customer discovery, which is a method where we approach different businesses to find out how they could benefit from our solutions. For instance, we have a hypothesis that our systems can be used in retail to analyze customer flow and organize shelves at supermarkets accordingly. We have many other hypotheses that we would like to test and for that we first need to learn how business processes are run on the inside and what kinds of tools could be relevant. Then, based on what we find out, we will be able to develop a product that will be in-demand on the market,” shares Alexey Serdiukov.