Data journalists – who are they?
It might seem that nearly anyone can make a simple data-based story. After all, the internet provides us easy access to a variety of data, which is no longer considered to be a privilege available to the special few but something available to anyone at any time. Not to mention that there are accessible statistics and visualization tools, such as Excel, Datawrapper, and Flourish.
However, data journalists have a harder job to do: they must take an array of specialized data and turn it into a compelling and useful news piece. They can get the data from publicly available sources, private agencies, governments, or non-profits and apply countless visualization techniques, including plots, tables, dashboards, and heat maps, to achieve their goal. Importantly, such stories often relate to some of society’s most acute problems – and this technique of analyzing fragmented bits of data remains one of the most reliable ways to identify these issues.
Where do they work?
The world’s first data journalism projects appeared in 2009, when The Guardian launched its Datablog; in 2012, some of Russia’s first data stories won the international Data Journalism Awards. However, this field is still considered a career of the future.
Nevertheless, data journalist positions are now open not only in media, but also in governmental organizations, banks, and analytics centers – places where there is big data that needs to be presented to someone who doesn’t specialize in it.
Who can become one?
Data journalists, not unlike science artists, don’t easily subscribe to just one label, be that exact sciences or humanities, which means that the field is open to professional journalists, who would have to pick up some analytics, as well as data analysts, who would need to train in storytelling and editing. At ITMO, students tap into data journalism within the Scientific Storytelling course read by Alexander Bogachev at the Science Communication Master’s program.

Credit: photogenica.ru
Where can you learn the trade?
Since 2016 the Higher School of Economics has been training data journalists within the first topical Master’s program in Russia. However, you can discover your knack for the field much quicker – at topical hackathons.
One such event is the national ScienceMedia hackathon, held annually by ITMO’s student media Megabyte since 2019. Having won a 2-million-ruble grant from the Federal Agency for Youth Affairs, this year Megabyte decided to dedicate the event to data journalism.
Apart from analysts and journalists, the hackathon welcomed designers and photographers because, as pointed out by Lidiya Rozumets, the event’s main organizer, all these specialists are needed to create a multimedia data story.
In preparation for the event, all participants were given an equal head start with the online workshops held by Andrey Dorozhny, one of the pioneers of data journalism in Russia; Alexander Bogachev and Yulia Krigan, data journalists and visualizers; Ekaterina Streltsova, a sociologist from the Higher School of Economics; Dmitry Volkov, an analyst at ITMO’s DH Center; and Olga Dobrovidova, a science journalist and lecturer at the Master’s program Science Communication.
“It is because of the growing amount of data in recent years that data journalism has been rapidly developing. Take COVID-19, for instance, when the data on death and infection rates was updated daily by country, region, city, etc. This information was in high demand, so it had to be visualized. At the same time, international data storytelling projects may have been too complicated to understand for Russian audiences just then, which is why journalists here started learning visualization. At about that time, data departments were opened in various media, while the educational market expanded with short-term data journalism courses and full-scale degree programs,” commented Yulia Krigan, a data journalist, a lecturer at the Higher School of Economics, and a mentor at ScienceMedia 2022.

Yulia Krigan. Photo by Megabyte Media
What data stories can you tell in 24 hours?
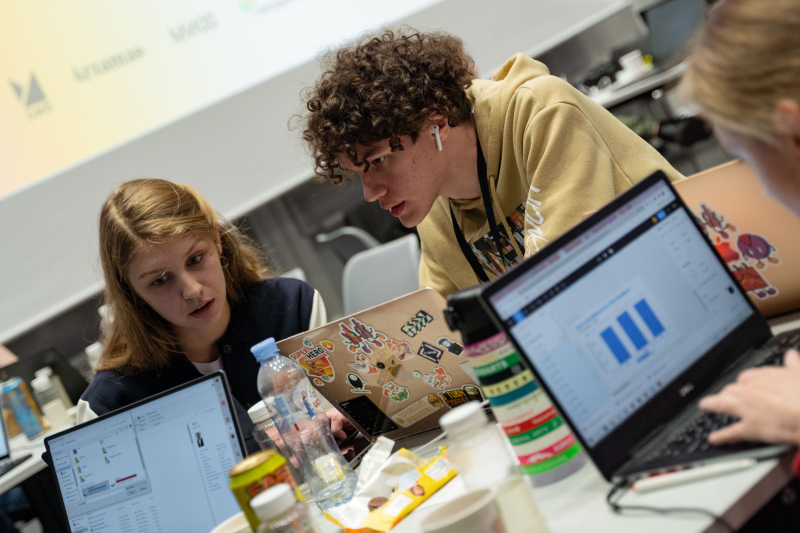
Twelve teams took part in the finals of the hackathon, each including an analyst, two journalists, a photographer, and a designer, who had to create a multimedia longread on a given topic in 24 hours. With each project, the jury evaluated the visual presentation, the story’s cohesiveness, and the quality, analysis, and presentation of data.
The participating teams had the chance to get a better understanding of their subject matter at the tours of different companies and plants organized within the hackathon. For instance, they visited a bakery’s production facility, a plant of the pharma company Geropharm, a public transport depot and training grounds, an agricultural company’s greenhouses, and a polyester fiber production site.
“It is difficult to create a full-scale data story even in a few days, so the participants’ main goals were to identify a problem, suggest a hypothesis, find the needed data, and conceive a possible solution. Maybe later, the organizations visited by the teams would offer to collaborate on their projects and make them ready for publishing. Alternatively, the teams could submit their projects to popular data-oriented media,” adds Yulia Krigan.
One of such projects could be an analysis of income levels of agricultural workers presented in the form of a ribbon chart and a heat map based on the data from the Unified Interdepartmental Information and Statistics System.
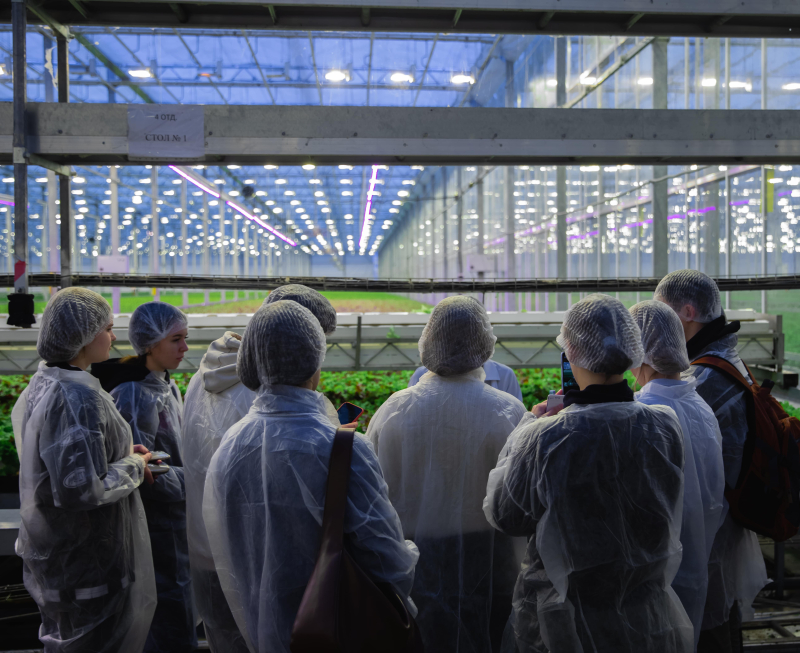
Participants visiting a greenhouse. Photo by Megabyte Media
The third-place winner informed its readers about recycling clothes made from polyester fiber. Having analyzed the issue of textile plastic waste and its possible solutions, the project’s team presented the results in dynamic linear plots and bar charts.
The second place was given to a longread about public transport in Russia, and specifically the fact that most of the vehicles in the country’s regions are actually those formerly discarded by its capitals. Based on the data from national projects, the federal budget, and analytics of transportation modeling companies, the team created graphic stacked column charts.
“As we’d learned the topic of our tour in advance, we started working out a hypothesis even before we met up with the experts. We knew that exploring the effect of transport on the environment would be a platitude, so instead we decided to take a look at the vehicles that get shipped to the country’s regions once they’d been discarded in Moscow and St. Petersburg. Coming from Tula, I see a lot of vehicles with Moscow branding, while there are nearly no new ones (with Tula branding). It turned out that it is a country-wide trend – for instance, 93% of all tramways in the Kursk Oblast come from Moscow. These old vehicles are inconvenient, they don’t have heating or ramps for wheelchairs. Moreover, they are unsafe: there is a place in my hometown where tramways tend to turn over. This seems to be a systematic problem connected to the way the federal budget is allocated to regions,” says Valeria Mikhailovskaya, a member of the project’s team and a journalism student at the Lomonosov Moscow State University.
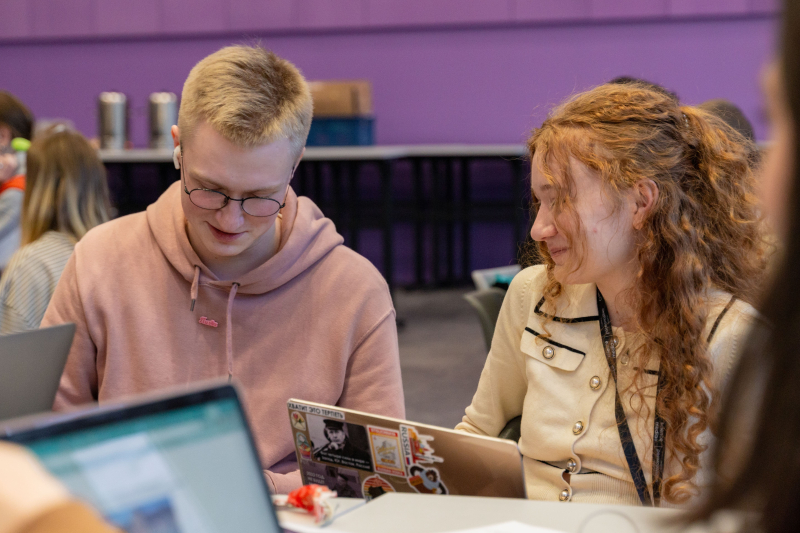
Arseny Kuvardin and Valeria Mikhailovskaya. Photo by Megabyte Media
Finally, the winning project used the data from logistics companies, Russian Public Opinion Research Center, the Moscow public transport department, and various media to try and say if electric buses will replace tramways – all using bar charts.
“In this project, we wanted to see if the transition from trolleybuses to electric buses could be damaging to the economy and logistics. We decided to focus on the human factor, so as not to stick to abstract terms and money. For instance, if we were to tell an elderly person who is used to trolleybuses that these vehicles will no longer be around, this person might experience a worldview crisis. They might have an abundance of memories connected to trolleybuses from their school and university years, for instance, and it can be that they wouldn’t want to get rid of such a memento. Especially if it isn’t economically viable. For instance, we’ve demonstrated that if a region already has a developed trolleybus network, it would be rational to keep it and introduce electric buses in those areas where there’s no existing transportation system. We believe that our project can be useful in public transport development strategies in the country’s regions,” explain project members Sofia Shchebenkova, a student of St. Petersburg State University, and Semen Baratov, a student of the North-Caucasus Federal University.
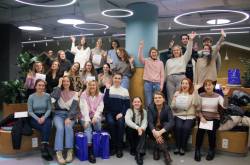
The winning team. Photo by Megabyte Media

Photo by Megabyte Media
All projects developed by participants of the ScienceMedia 2022 hackathon can be found here.