
Data analysis and visualization skills are becoming more and more valuable in a wide range of fields. You’ve been working in this field for quite long. How did you get interested in it?
Usually, infographics specialists are people with a background in mathematics or programming but I’m more of an exception. I’m a former general practitioner, cardiologist, and an X-ray surgeon. When I was studying and working, I dealt a lot with various figures and always tried to organize them and represent visually. At some point, I decided to take some time off and started studying graphic design on my own. I even took intensive training at the British Higher School of Art & Design. That’s how it all started and now I’ve been into this field for 10 years.
In general, people tend to appreciate beautiful and complex infographics most. I worked in this direction when I was an editor at the RIA Novosti new agency and tried my hand at everything, including complex interactive graphics. But with time, I realized that I like the most common line charts, bars, and histograms more and they’re not as simple as they might seem. I immersed myself in this topic so deeply that I even wrote the book called Graphics That Convince Everyone.

The cover and review of Aleksandr Bogachev’s book. Credit: ozon.ru
How did you master new skills?
When I worked at RIA Novosti, I believed that I should pick up new tools, techniques, and approaches with each project I’m engaged in. This sector is growing rapidly and the most relevant skills are acquired by practicing professionals. That’s why it’s important to keep reading, listen to experts, study their projects, and always think about why they went one way or the other. When you know the basics, you will have less trouble coming up with something new based on what you’ve already seen.
Which projects did you manage to implement while working at different companies?
We executed dozens of projects that brought us many international awards. I love most of them, for instance, the discovery of Antarctica and the history of Hedgehog in the Fog (a Soviet animated film – Ed.)
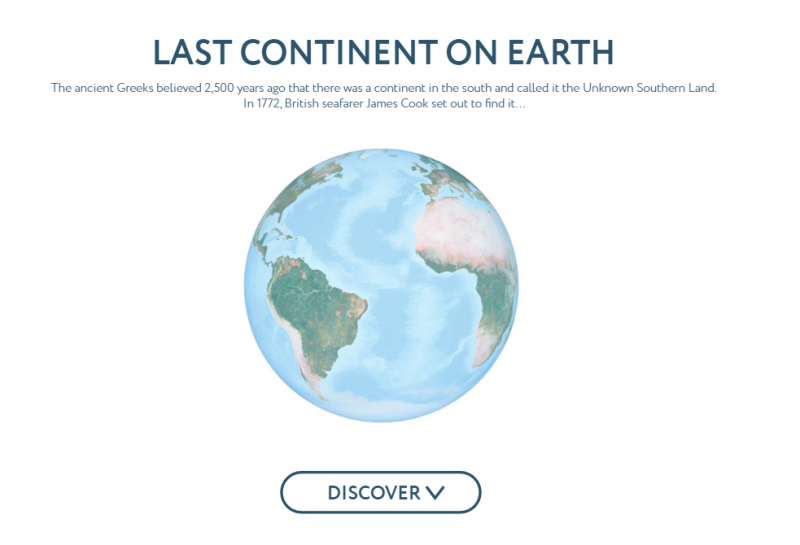
The homepage of the Antarctica project. Credit: ria.ru
What do you have to say about data visualization in Russia?
First, data visualization is an umbrella term, so we should be more specific here. Russia’s media, for instance, is lagging behind such world’s leaders as the New York Times, the Washington Post, Bloomberg, and others. But there are powerful teams, too. In the business sector, everyone’s using the same tools. Both Russian and Western companies are hampered by low data literacy among data specialists. Plus, they often lack basic knowledge in visualization. That’s why I’d like to launch a large-scale course for thousands of students at ITMO.
What did you stem from when creating your visualization course for Master’s students?
I developed a hybrid online course, which includes prerecorded short videos and assignment reviews over a one-on-one call. I’ve been filming and editing for several years now yet I always challenge myself, try new formats, and review my methods to create exciting products and keep growing as a professional. It’s important to me that students who complete my course would not only have some knowledge and skills but also an understanding of how they can apply them. This course is basically a quintessence of what I know and what I practice. It included video series, tests, and interactive tasks.
What do students learn at your course?
The course covers all aspects of data visualization: how to choose data, prepare it for visualization, and what types of data exist. I also elaborate on online services that students can use for their work.
During the course, my students learn how to present graphics professionally, choose titles and subtitles, as well as scales and captions. They also learn to visualize additional information. In general, we work with various formats to develop beautiful and comprehensible graphics that look good on all devices. By the end of the course, the students will be able to pick some data and visualize it correctly.
Credit: photogenica.ru
Did you take into account the fact that your target audience will be future science communicators?
Science communication students are great. They are researchers with a background in science and they’re also communicators who need to be able to explain their ideas in an accessible way. That’s something we have in common. Plus, I’m into science, as well, I even published a few papers in Pubmed.
What skills do you think visualizers should have?
To begin with, I think that visualizers should be able to work with data and make conclusions based on it. Then, they should be fluent in data visualization culture, know how to present data correctly, and understand all the dos and don'ts. What’s more, science communicators should be a bit of journalists themselves: they should know how to formulate their thoughts and feel their audience. And, most importantly, they should be eager and curious.
What sources would you recommend for beginners?
That’s a hard question. There are plenty of sources in English, including storytelling with data, as well as numerous Telegram channels in Russian. Plus, there’s a list of useful sources on my channel Chartomojka.