Professor Valentina Gorbatenko, head of the Department of Meteorology and Climatology at Tomsk State University, explained where colored snow comes from, what determines a snowflake’s shape, and why it’s been snowing a lot in the Sahara Desert.
Mikhail Semenov, an associate professor at Tomsk Polytechnic University’s Division for Experimental Physics, spoke about the mathematical terms that help scientists describe the shape of snowflakes, explained the concept of the Koch snowflake, and how that natural formation inspires computer scientists.
Top snowfall spots – and flurries in the Sahara

To us Russians, as inhabitants of one of the snowiest countries, snowfall is a regular, annual occurrence. But in fact, almost half of the Earth’s population has never seen actual snow. Nevertheless, climate change now makes it appear in very unexpected spots – in the Sahara Desert, for instance, where it’s already snowed three times in the past 40 years. On January 7, 2018, it saw 40 centimeters of precipitation, which lay for a while and only melted by sundown.
Meteorologists explain that this has to do with a process called meridional circulation: due to the climate change processes of the recent decades, warm air masses are being pushed further towards the Arctic, while the cold air masses from that region move down south.
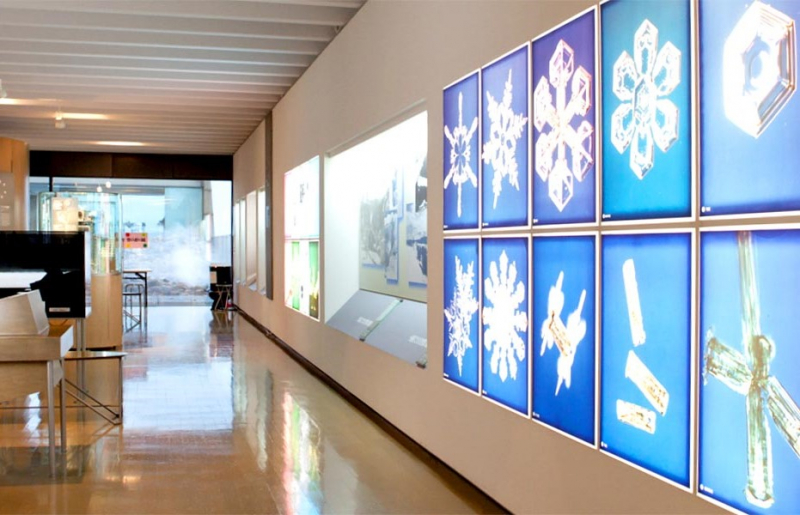
The most common place to find snow isn’t actually in the northern regions or the Arctic, but in the north of Japan, in the city of Aomori. Japan is also home to the world’s only snowflake museum, as well as a museum of snow and ice, named after Nakaya Ukichiro, a renowned physicist who studied natural snow crystals.
It may seem strange to some, but among the world’s coldest countries are Kazakhstan and Mongolia, where the average temperature is zero degrees Celsius. But, of course, the largest volume of snow can be found in the Antarctic, where the snow cover can reach up to 3 kilometers in height.
Colored snow and the words to describe it
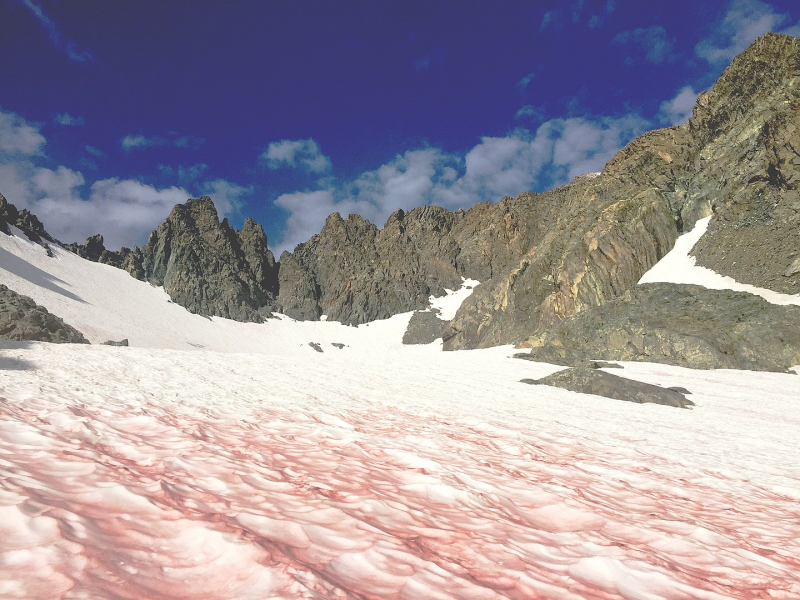
One of the most amazing phenomena one may encounter on Earth is colorful snowfall – and it happens more often than you’d think. For instance, those in the Omsk Oblast could witness yellow snow in 2007, and the inhabitants of Primorsky Krai observed pink snow back in 2006. In 2002, multi-colored snow fell on Kamchatka; in 2006, people in Colorado encountered unusual “watermelon snow”, which not only exhibited the fruit’s characteristic color, but even smelled and tasted like it.
Snow can be green or even purple. The cause for that are special algae which only live in cold conditions and die at temperatures below -4 Celsius.
In many cultures, the color white is symbolic of death and evil – and anyone who’s been to the Far North during the polar night knows why. Norwegians have a saying: “the north wind made the Vikings” – strict, courageous, ascetic, yet also charitable and strong people. Specialists consider the specific Scandinavian mindset, described by many as phlegmatic, to be a direct result of these people’s living conditions.
It was previously believed that the various Eskimo peoples had the most words to describe the many types of snow and ice. But the Saami people of northern Scandinavia have them beat: their lexicon includes at least 180 such words. For instance, they have words for the year’s first and last snowfalls; the snow that is and isn’t fit for building; for a slow- or quick-falling snowfall. There’s even a special word for the kind of snow that covers the entire village.
How snow is formed
The idea that snow is merely frozen drops of rain is a major misconception. In fact, airborne water goes directly from the gaseous state into solid snow crystals, bypassing the liquid phase. This process of “skipping” a stage is called sublimation.
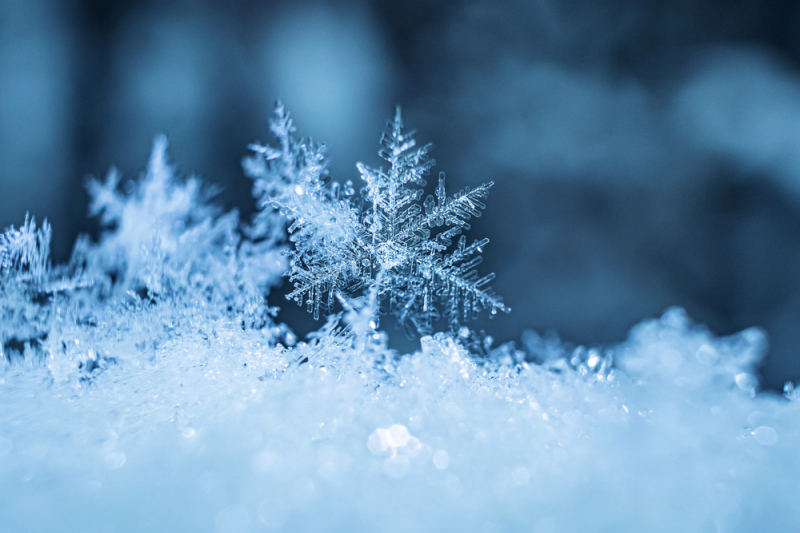
An average snowflake is 5 mm in diameter and weighs around 0,004 grams. But there are exceptions, as well: on April 30, 1944, palm-sized snowflakes are said to have been seen in Moscow. The special, six-point shape of snowflakes was first described by the Swedish priest Olaus Magnus in 1555, who was the first to observe that no matter how complicated its pattern, every snowflake is always hexagonal in its nature.
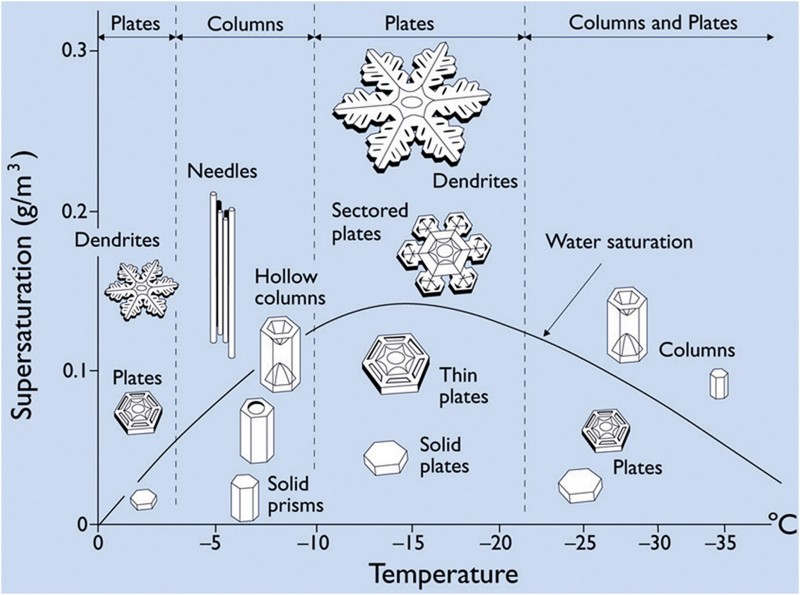
But snowflakes aren’t always dendrite-shaped. They can take on the form of plates, rods, hollow rods, columns, needles, and so on. This is directly determined by environmental conditions: the various combinations of temperature and air humidity.
For instance, stars are formed at -2 and -15 degrees Celsius, while columns and thin needles are formed at -5 and -10. Another factor that affects a snowflake’s shape is wind: the weaker it is, the larger they are, while strong winds break them up into shards. These patterns have been described by the aforementioned Nakaya Ukichiro.
How snowflakes inspire mathematicians and programmers

The reason for this hexagonal symmetry is the positioning of water molecules within the lattice of crystalline ice. Looking at a graph of the H2O molecule, one can easily see its hexagonal shape. The simple formula by which snowflakes are formed is also used in fuzzy automata theory and is actively applied in computer modeling. The shape of the snowflake itself has served as an inspiration for data storages and databases.
The Koch snowflake is one of the most well-known fractal curves. It consists of an equilateral triangle, in which each side is split into three equal parts, with an identical triangle placed within its middle. If one were to remove the triangles’ bases, the result would be a six-point dendrite – a snowflake.
You can create some fractal snowflakes of your own using a number of online services, such as this one. This is a simple demonstration of fractal graphics, which are used, for example, to create maps and landscapes in video games.
You can watch the full recording of the lecture (in Russian) on the official YouTube page of the Information Center for Nuclear Energy.