Social media are constantly changing – in part, by adopting new features and algorithms that search for and recommend information deemed interesting to each specific user. This work goes on out of users’ sight – meanwhile, every day teams of programmers analyze data, search for ways to optimize various processes, test hypotheses, and evaluate the results over and over. The better tools these analysts have, the more information they can provide to developers who will then use it to make the system more convenient for its users.
ITMO University and the social network VK have been cooperating for a long time. The network actively engages the university’s expertise in the solution of complex tasks, while the university gets an important partner interested in hiring ITMO’s students and graduates.
The latest in a series of ITMO and VK’s collaborations is the joint work by scientists from ITMO’s Machine Learning Lab and the members of VK’s CoreML team. In the last academic year, together they have implemented two projects on data analysis and neural network training.
Metrics analysis

Every service is interested in gaining new users, offering them interesting information, and encouraging them to follow internal links and explore new content. It’s all the more important for a social network created to facilitate people’s communication, exchange of information, and access to news and interesting facts.
From the amount of time users spend on social media to the frequency with which apps are opened, such key factors are also known as long metrics. These are very hard to influence directly, but it’s possible with indirect targeting.
“There are indicators and metrics that VK can calculate,” says Ivan Smetannikov, deputy head of ITMO University’s Machine Learning Laboratory. “For example, the average number of views of some posts, feeds, and likes are short metrics. These can be influenced directly, for example, the number of likes under a photo. You can move the like button farther away or hide it altogether, and the number of likes will decrease. It’s important to understand how these short metrics, which could be influenced, are connected to long metrics, which we want to influence. We want to build an objective function that would allow us to change long metrics by impacting the short ones accordingly.”
But short metrics are many and varied, and their impact on the long ones isn’t always obvious. There are also other factors that determine social media use, which is why generating more accurate hypotheses in relation to experiments with this or that function requires a special tool, which is what ITMO scientists and VK specialists set out to develop.
“We tried out several approaches and eventually opted for Bayesian networks – this is a way to represent dependencies via directed graphical (a graph is a network of points or vertices, as well as lines or edges connecting them) structures, where vertices represent metrics, and edges – dependencies,” says Ivan Smetannikov. “But there was one difficulty: in our case, Bayesian networks didn’t work in their pure form, as this assumes that all the graphs’ vertices are known to us. When we’re talking about a social network, it’s obvious that we can’t measure all the metrics there are, as we simply wouldn’t have enough imagination. It turned out that we had lots of hidden parameters which did hold some sway but we couldn’t observe them. And this added some problems.”
In the end, though, the specialists did build such a graph based on experimental data garnered by VK. Going forward, the graph will be introduced and tested for accuracy – the social network will look into how short metrics change and how much this influences long metrics.
“Every time we do something, we always conduct A/B testing: test one version of a new feature on one group of users, test another version on another group, and don’t test it altogether on the third group,” explains Lidia Perovskaya, manager for educational projects at VK. “We have to monitor whether these users’ behavior really changes based on the experiment. This tracks well with what has been done as part of the research. We take data from A/B tests – we really do have lots of it, as experiments are conducted almost daily – and systematize it in this graph form in order to identify the suggested dependencies.”
It will take some time to test the graph created by ITMO University researchers. However, as Lidia Perovskaya notes, as a result, the social network obtained a universal tool for analyzing available data, which can be used not only for one single study, but also in any future ones.
“Some users react better to news presented via visual data, pictures, while others prefer longreads or listening to podcasts,” she comments. “We can take these parameters into account when forming our smart feed, which will impact how much news is viewed by one user, how much they enjoy scrolling through the feed. This is just one example of the dependencies we want to track down. Thanks to our joint project with ITMO, we, as it seems, are now capable of doing that; what’s more, we’ll be able to continue with it even when we come up with new features. The major perk is that this algorithm is universal, this isn’t just a one-time development – all future experiments will be embedded in the overall structure, detecting new correlations.”
Neural network training
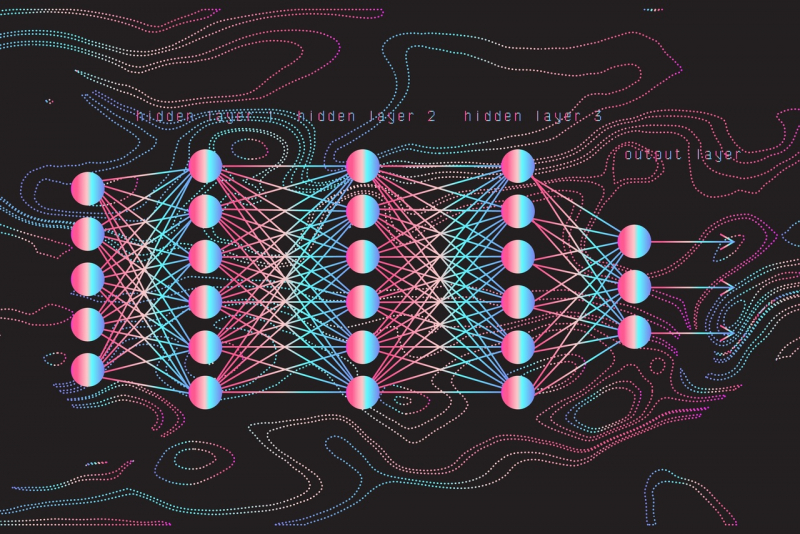
The second joint project by the VK team and ITMO’s Machine Learning laboratory focused on training a neural network responsible, among other things, for the classification of content. It is this neural network that selects interesting posts for different types of users. But it needs some training to do its job.
“We group all the news generated in our social network into categories,” explains Lidia Perovskaya. “This allows users to subscribe to what they find interesting: for example, if you like traveling, you can always get your fair share of cool pictures and posts about that. At the same time, the authors can make sure that their content reaches readers quicker, because they can either pick the category themselves, or we can do it automatically. The difficulty is that for the neural network to select the right category, some data has to be processed manually with the help of experts, and this requires lots of human resources. That’s why we resort to machine learning – we ask for some data to be analyzed manually, and then create a network that chooses categories automatically. The interesting thing is that news changes, develops, new categories may appear, and so from time to time, we still turn to experts for help so that our model could be further trained.”
But how does one identify what data has to be categorized by experts for the best results? What’s more, social media content is multi-modular – one post can include music, videos, pictures, and text. For a neural network, this proves to be a serious test – to identify something that unites all these parts so that the post goes to the right category. This is where ITMO scientists were also asked to help.

“There is this thing called active learning,” points out Ivan Smetannikov. “In regular machine learning, you take the entire array of data and feed it to a neural network piece by piece. As a result, it gradually becomes better and better at recognizing things, for example, cat pictures. In active learning, you can feed the pictures to the network not randomly, but in some specific order to achieve results as soon as possible. One of the tasks of active learning is to select data that will not only improve your model, but also do it in the most optimal way. This was the approach we took in this project.”
What’s more, instead of just analyzing the content layer by layer, the neural network weaved different types of content together in such a way as to achieve the best result. These two components – multi-modularity and active learning – was what was used to optimize experts’ efforts, adds Ivan Smetannikov.
Scientific results
The main part of the project was completed by mid-July. Now, its results are used to develop research papers on machine learning, data processing and other fields of knowledge the projects touched upon. As noted by Lidia Perovskaya, this combination of applied tasks and the opportunity to advance research is important to VK.
“We’re working on publications concerning organizational and scientific aspects so that everyone would have the opportunity to apply our results in their own projects,” she shares. “It’s really great that this in equal parts is an applied invention which is implemented into the social network’s daily work and helps save resources, and a contribution to the topic which is now actively studied. Collaborating with universities is very valuable – it makes it possible to move science forward instead of just companies keeping the results to themselves.”