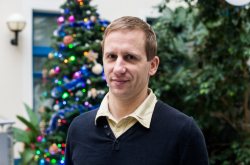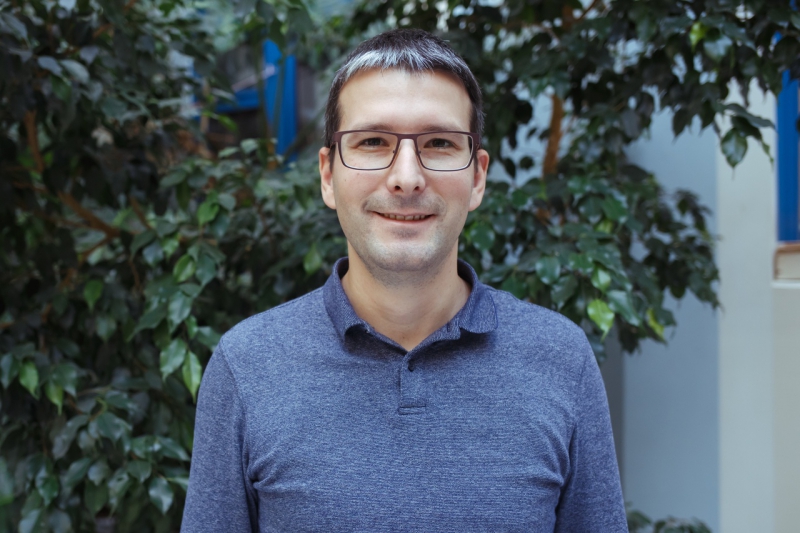
You are a researcher at Jožef Stefan Institute, Slovenia. Can you tell us a little about your work there?
I started with research in the field of text mining and search technology. After that I moved on to digital enterprises and extracting knowledge from complex systems that are at work there. Namely, I was working on a way to visualize this information and detect patterns within.
Did you get any results? What is their practical application?
I was in the team that created an anomaly detection system that is now used to monitor the server infrastructure by several major companies. The system is based on monitoring system logs (log files, or logs, record system information of a computer or a server and contain information about certain actions performed by a user or a program – Ed.). And when it detects something unusual, it sends a notification about it. In other words, it doesn’t rely on a number of preset indicators, but instead tries to identify the normal server condition and notifies us when something changes.
This system has two types of monitoring mechanisms. The first one is for short-term monitoring: it identifies a process that has only just gone astray; this one is handy for pinpointing a couple of current bugs. The other one works long-term and tracks smooth fluctuations in the system. For example, if a server drive is becoming full and the processes are gradually becoming slower, people typically don’t notice anything until something serious happens. We have created a system that can track both fast and slow processes.
What kind of data do you work with?
The projects I am involved in concern business data. But I also work with other types of data, for instance, in the field of smart factories and logistics. This I do within the framework of our institute and a number of European projects.
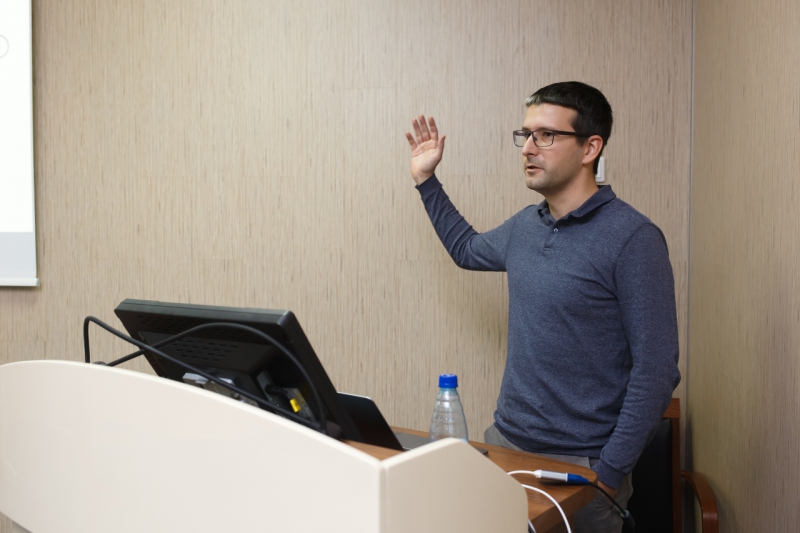
Today you are giving a lecture on data visualization at ITMO University. What kind of knowledge and skills will the students be able to acquire?
They will learn to present different types of data in a generic form in such a way that later it could be analyzed with generic mechanisms. This lecture will also cover the principles of machine learning. In other words, you take some data, be that pictures, texts or other machine data, then transform it, compile it all together, and present it as a vector, for example. After that, you can apply existing modules to these data. You already have all the tools for these tasks, so you don’t need to develop them yourself.
Let’s talk about data visualization. This discipline, as well as data analysis in general, is rather young. What do you consider the most outstanding results in the field over the last couple of years?
In my opinion, the most significant change of late is data availability. Our main problem used to be that we had a lot of analytical mechanisms that could do many things but were still only applied to data collected under laboratory conditions. Doing so, it was difficult to achieve practical results. They could only be implemented in experiments, like chess, for example. But the results were not suitable for real-life conditions.
Nevertheless, collecting data is still challenging.
Data collection always creates problems, it is always hard to combine different databases. It is also hard to manage the streams of data available today. Let’s say that you have a petabyte of data, how would you even start processing it? You can’t just open a file and see something in it, you will need good tools and visualization techniques, and, naturally, well-trained experts to do this job.
If students consider a career in this field, what kind of skills do they need?
I think, first of all, it’s important to be well-versed in computer systems. If you have deep knowledge of computers and you are a good programmer, then many tasks are much easier for you. A solid understanding of mathematics also goes without saying. Finally, a certain amount of enthusiasm wouldn’t hurt.
What are your personal sources of inspiration? These days data visualization can also be viewed as an artform.
Yes, it is actually something in between art and science. It is hard to define in these terms. I started out as a software developer and then landed a job in an artificial intelligence lab. After that, I was involved in a couple of captivating projects, the outcome of which I plan on presenting in the future. It just so happened that developing big data analysis algorithms has always been something I enjoyed.
Data analysis and visualization these days is used in different areas, from medicine to media. Speaking about the latter, there is even a whole new field called data journalism. Do you think that the use of data analysis mechanisms has affected the quality of information available online and on social media platforms?
I believe more information should be backed by numbers and charts. Especially in an important field such as journalism.
In recent years, automatic tools have primarily increased the amount of online information. For example, news aggregators like Google News make a lot of information available with minimal human effort required.
However, I believe that in this abundance of information, we will have to rely on data analytics mechanisms to filter information that is not of interest to us and present different viewpoints on the information that is. We can already see automatic content filtering, like hate speech, in large social media platforms. I believe that in the future we will also have to rely on bias detection and sentiment analysis algorithms to highlight potentially conflicting pieces of information and present different viewpoints.
Will we one day use this as a tool to identify fake information?
It can happen. It is one of the tools that can play a key role in this field.
How would it work?
We would still need a person to examine the output and determine whether something is fake or not. But computers can, for example, highlight different articles that cover the same event from various points of view. Thus, we won’t need a reporter to put all of these pieces of information together.
Does this mean that journalists will still have something to do?
Yes, I think we will still need someone to monitor this process, at least at the current stage of technological development.
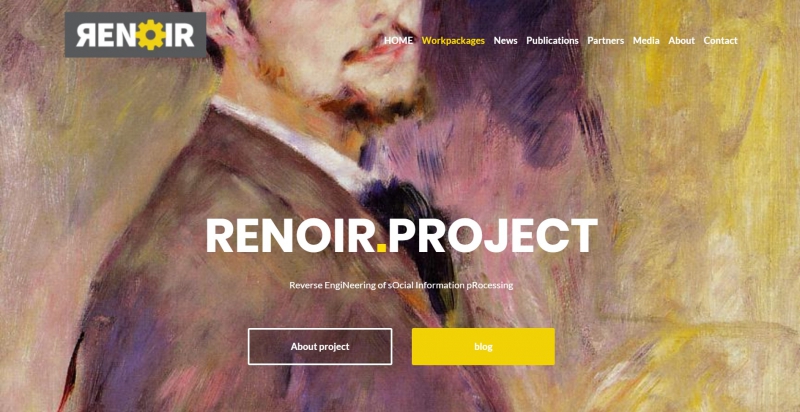
That’s good news! RENOIR, a large European project, also works with social media data. Tell us about your work in its framework.
This project studies the ways information can be spread across social media and we are working on a way to determine where the spread of information may stop. Say, for example, we have a big part of the network here and another part of it is somewhere else. Our method will have a way to automatically spot the border where these two fronts of information will collide and stop spreading.
Thus, our ultimate goal is to understand how information spreads and predict where a new piece of information will eventually get to. This can be applied in marketing, as by using this data we would be able to create information distribution strategies.
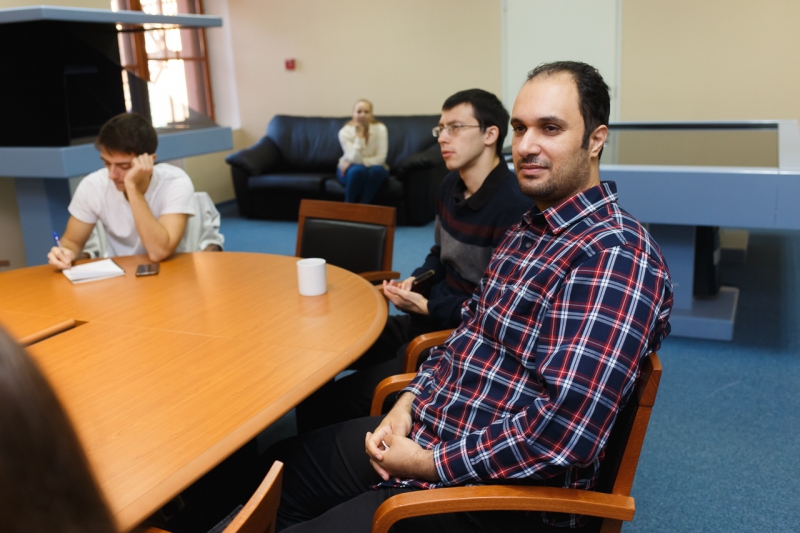
Do you collaborate with ITMO University researchers on the project? What does this process involve?
Yes, we established collaboration when I came here. Now we are discussing a possible publication that will evaluate a number of methods.
What kind of results are you planning to achieve by the end of RENOIR?
Personally, I am interested in learning more about the spread of various social phenomena and the mechanisms behind them.
If we consider the future of data analysis methods, do you see this field changing the way we share and consume information?
Yes, I believe that the spread of information will become much more targeted. For instance, instead of spending large sums of money on advertising campaigns, businesses will identify a small number of sources that can spread information to their target audience.
At the personal level, I believe that data analytics will primarily change our audience. Data analytics tools are very effective at identifying people with similar interests and can direct information between them. We already see the effects of this phenomena with the so-called social bubbles.