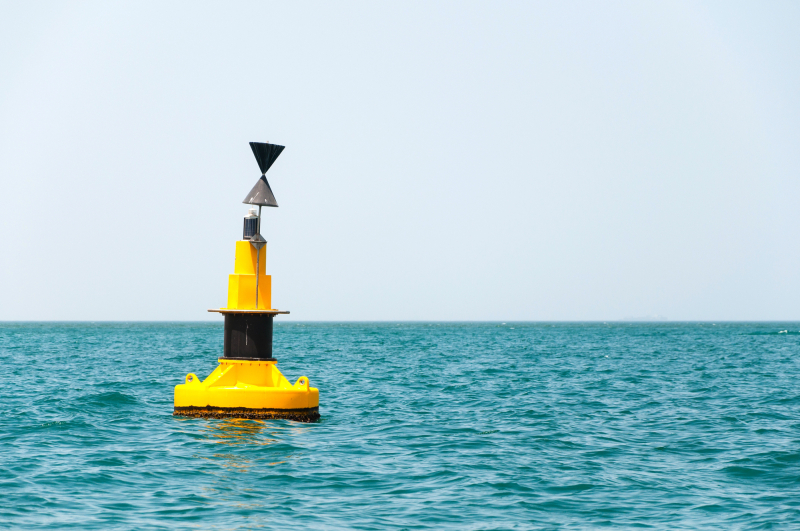
Drifting buoys are deployed to study short-period internal waves, i.e. oscillations that occur between the warm and cold layers in the water column. Though imperceptible to the eye, these underwater oscillations play a pivotal role in ocean circulation as they transport heat, salt, and nutrients, which are essential for the survival of marine ecosystems. Compared to fixed stations, drifters can be easily installed in bad weather or a remote location; they also move along with the current and collect data at multiple points at once.
A buoy is an automatic monitoring device equipped with various surface sensors for determining water depth and temperature and built-in GPS receivers, data collection systems, and satellite modems. Drifting buoys continuously measure water temperature at various depths and record its location; the data it collected is transmitted via satellite to a receiving station – a conventional PC with specialized software connected to satellite antennas and a global positioning system.
The processed data is then converted into an Excel spreadsheet that contains dates and times, buoy coordinates, temperature, and hydrostatic pressure used to recalculate the actual depth at which each sensor is located. All these indicators are affected by noise, and the researcher’s task is to extract the useful signal and determine the amplitudes, periods, velocities, and directions of short-period internal waves. Previously, scientists had to use MATLAB to analyze this data: they had to run scripts, enter parameters in the command line, and navigate themselves through dozens of graphical windows; worse still, data exchange between different software took a lot of time due to incompatible file formats.
“We used to have no single interface for drifters' data and so transferring it between different programs became a tedious chore: we had to manually convert data from one format to another. To process data, namely standardize and verify measurements, scientists needed to have programming skills. All this took a lot of time, and it was hard to pass on the experience gained during expeditions to young scientists. Therefore, we needed a new software product that would work in real-time,” shares Aleksey Zimin, a chief researcher at the Shirshov Institute of Oceanology.
The oceanographers reached out to ITMO’s Center of Usability and Mixed Reality just in time; at that particular moment, its head Artem Smolin was looking for cases for students’ practical training. He introduced the scientists to Ksenia Lipaeva, a student at ITMO’s Faculty of Software Engineering and Computer Systems, who was willing to develop an app as part of her two-month training. As a result, she developed MATLAB-based software that can be installed via an .exe file and contains all the essential libraries and functions, with no need for additional configurations.
“The installer weighs much less than MATLAB and takes just several minutes to download. The app runs on a laptop completely offline, without internet collection, so it can be used even in Arctic expeditions where satellite communications are unstable,” explains Ksenia Lipaeva, the developer of the app and a student at ITMO’s Faculty of Software Engineering and Computer Systems.
Ksenia Lipaeva. Photo by Dmitry Grigoryev / ITMO NEWS
Data analysis is performed in six stages; each stage is presented as a separate tab, akin to browser tabs, which a user navigates through step by step. In the first tab, the user needs to upload an original file (a table of timestamps, buoy coordinates, temperature measurements, and hydrostatic pressure data) into the software. The system will automatically read all columns and do the preprocessing: it removes empty cells, which occur due to connection issues or temporary failures, and outliers (abnormal values distant from the rest of observations), smoothes noise, and filters high-frequency measurement interference. Then, the application builds isotherms that show the temperature patterns over time, with temperatures marked by different colors (e.g., 5° – blue, 6°C – green, etc.).
At the third stage, the researcher needs to select the temperature range of their interest and obtain a detailed line graph that charts the depth change of the isotherms. After that, they need to select the time period by clicking on the segment when a group of internal waves presumably passed. The fifth stage involves a cross-correlation processing: the algorithm calculates the function of cross-correlation between signals from different drifters, indicates time delays, and accounts for the Doppler effect (the change in the signal frequency due to buoy movement in relation to the wave) and other distortion. When opening the sixth tab, the user sees the final result – graphs and tables that represent the velocity and direction of wave distribution and the period, amplitude, and structure of a wave packet.
Such technologies do not exist in Russia and, generally, similar tools for analyzing internal waves based on drifter data are extremely rare worldwide. The principle of phased analysis employed in the app can be adapted for other oceanologic tasks.