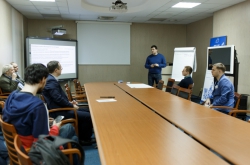
This time, the meeting was focused on big data and its use in research. It was organized by the Graduate School of Management of St. Petersburg State University and the St. Petersburg media group Bumaga.
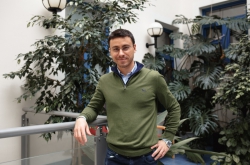
Among the participants was Ksenia Balabaeva, a PhD student and a research engineer of the Digital Healthcare research team at ITMO’s National Center for Cognitive Research. Her presentation on the use of machine learning in comprehensive forecasting of diseases progression and the extraction of data from patients' medical records was named one of the best projects along with a report by Ruslan Dokhov, a prominent urbanist, head of research at company Habidatum, and an employee of the Department of Social-Economic Geography of Foreign Countries at Lomonosov Moscow State University. As a result, they both became winners.
“Before that, I listened to the presentations of young scientists, and I thought it was funny and interesting. I wondered what it’s like to be in their shoes. During the preparation, you work hand in hand with an expert on public speaking. It’s useful for scientific conferences and will help you make your report exciting and understandable even for unprepared audiences. During the rehearsal, we had the chance to listen to each other. Everyone put a lot of effort into their work and made it interesting. That’s why I didn’t really expect a victory and was quite surprised when I won,” Ksenia Balabaeva shares her impressions.
Among the speakers were also Alina Vladimirova, a researcher at the Center for Southeast Asia, Australia and Oceania of the Russian Academy of Sciences, who spoke about how historians work with big data, and Dmitriy Skougarevskiy, a PJSC MTS associate professor of Empirical Legal Studies Interests in St. Petersburg, who demonstrated the research results on money transfers to prisoners in Russian through the FSIN wire transfer system, as well as Vladimir Gorovoy, a data science product manager at Yandex.Verticals and a senior lecturer at the Graduate School of Management of St. Petersburg State University, who presented an algorithm for sorting rental and selling ads based on the quality of repairs in photographs.
Read on to learn more about the projects and other participants of Science Slam Big Data.
How can digital medical records help specialists predict diseases?
Many, if not all, would like to know in advance their chances of developing this or that disease. Such technologies (eg. DNA analysis) already exist but not everyone can use them due to their high cost. However, there is also an alternative: models based on the data from a patient’s medical record. When you come for an appointment, you share a lot of information about yourself, including your bad habits, allergies, and so on. Often medical specialists ask you about your family medical history. All this information can be used to make predictions about your future health.
Reading and analyzing the records of hundreds of patients, however, is challenging. And this is where big data algorithms come to the rescue. Researchers can use data from medical records to build models that will analyze the relationships, assess the risk of developing diseases, make prognoses to therapy, and select drug treatment.
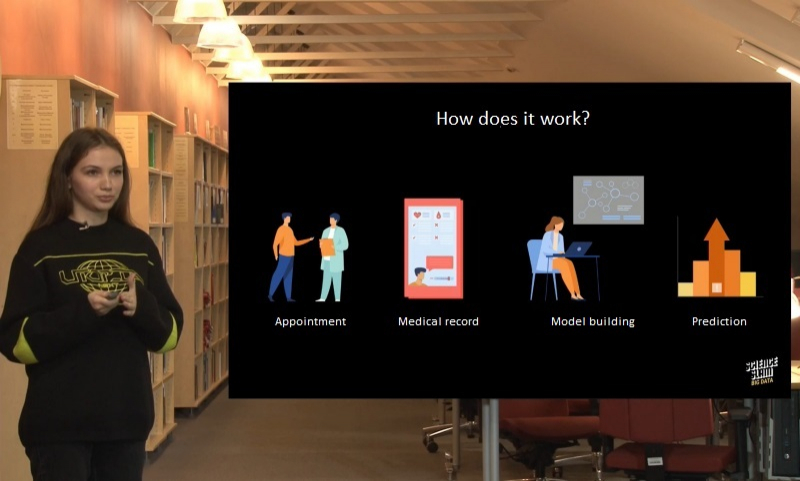
How do you design such a model? All information from the medical history is recorded as text. The researcher’s task is to find relevant information – such as specific events in a patient’s life – in this text by, for example, using keywords. However, it won’t work if the names of diseases are misspelled. And what to do if there are other diseases mentioned in the history and information about both the patient and their family that needs to be separated?
The first task is, probably, the easiest one as it can be solved with the use of automatic correction of errors and typos, for example, an algorithm based on the Damerau–Levenshtein distance. This method estimates the number of changes needed for the correct spelling of a word. It requires a neural network that will analyze the meaning of words and replace them correctly. The hint lies in the context – we can analyze the words used together with a specific word, for instance, “pancreas.” These can be “tumor”, “ulcer”, “disease”, “pain”, “cancer”, etc. To do this, you need to collect a large corpus of texts with correct spelling and use it to train a language model.
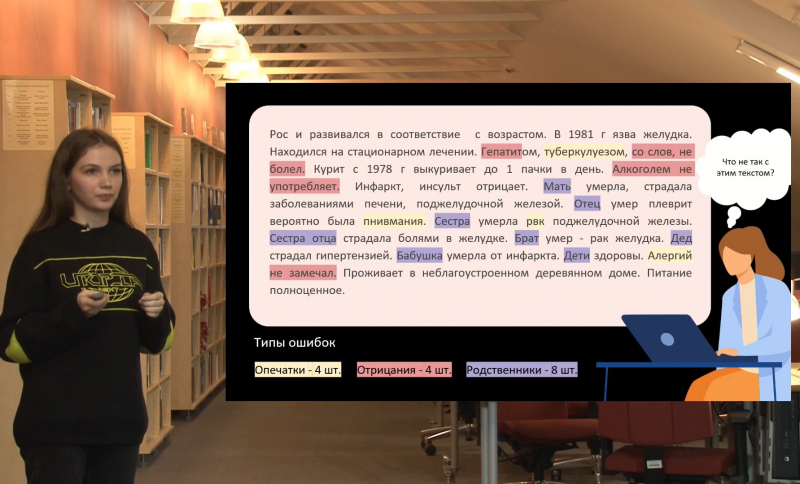
The second task, however, requires two stages. To separate facts, you need to use a binary classification clustering the pieces of information into two groups: patient and non-patient. This is followed by a more complex multiclass classification process, which takes into account all kin networks. The same algorithm can be used to make a “tree” of inherited diseases, which also plays an active part in our prediction model. This results in a checked and prepared text that can be automatically analyzed by the algorithm and used for a prediction model.
How can big data improve urban life?
Ruslan Dokhov spoke about how urbanists use big data. In urban planning, mistakes are often extremely pricey: history knows a number of cases when millions of dollars were wasted to construct new urban districts and satellite cities, which remained unoccupied.
How can you ensure that new districts will be appreciated? And how can you create a 100% working plan? Over the past century, people have got a better understanding of urban systems. Their two main features are spatial organization and hierarchy.
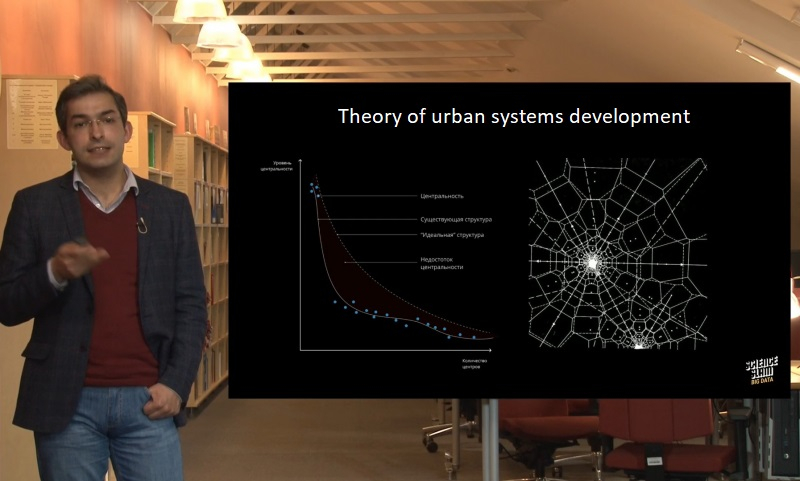
The placement of urban centers and attraction points is no accident. We can accurately predict where they are most likely to appear based on a large amount of data: GPS tracking of residents, semantic data on the opinions of residents (social networks, media, and surveys), data on the real estate market and purchases, as well as the paraments of the physical environment (air quality and pollution level). But here comes a problem: this data is not collected using validated methods but other systems. So, you have to filter out some of the noise and leave only valuable information by selecting analytical indicators.
The key indicator is the so-called centrality. The research team of Habidatum proposed a formula for analyzing the diversity of sports in a particular area, the number of its visitors, and its popularity using bank transactions. This formula helps researchers to define the hierarchy of districts and thus make changes in the situation.
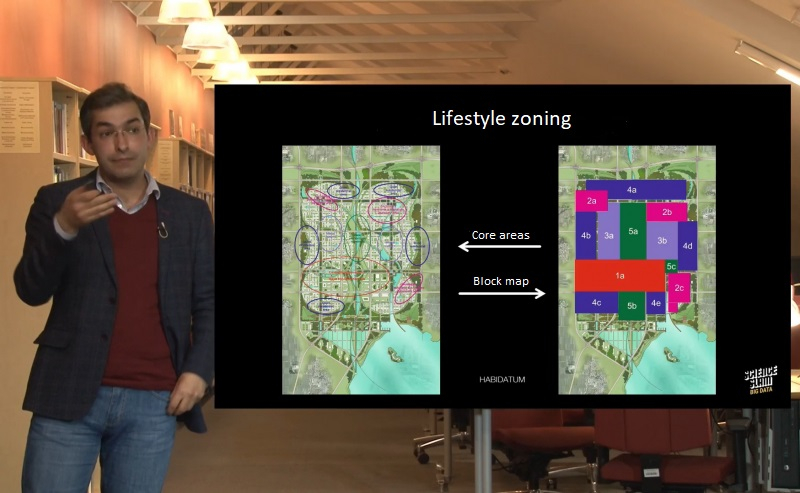
In fact, this is the purpose of urban planning. Urbanists can either improve the current situation by developing infrastructure or create new attraction points in the periphery.
China, for instance, has a five-year urbanization plan. Its aim is to take the weight off Beijing by building several cities for 500,000 inhabitants around it. For now, the construction site is just an empty field but the Chinese authorities want to know what the city will look like in 50 years. To achieve this goal, the research team of Habidatum developed approximate zoning of districts by the type and density of population activity during the day. This includes business and city centers, quiet areas, and mixed-use zones. Then, they found analogs (China, Southeast Asia, and the business center of Seattle, the US) for each type of zone. The algorithm used these examples to analyze urban rhythms in these cities and generate models of future ones. It calculates the amount of people at this time and in this place. Based on these figures, we can predict popular spots and the best locations for businesses and special architecture.
A full version of the presentation can be found here.

