
It’s no secret that the processes that take place in our bodies can be connected to various genes. A predisposition to baldness, obesity, or bad eyesight can be genetic, much as some diseases, but how can we tell which part of the genome is responsible for a specific condition?
Modern technologies make it possible to identify the correlation between a specific gene and a process in the organism, but it doesn’t necessarily mean that there really is a connection. A team of scientists from ITMO University have proposed a new method that makes it possible to assess the probability of such a connection for every gene. The modern advances of genetics and bioinformatics help us to better understand how the human organism works and how its inner workings are connected to genes. Every once in a while, we see articles in the media about scientists discovering insomnia genes, baldness genes or hyperactivity genes.
“By comparing the genes of a human who has a specific disease or another process in their bodies that we’re interested in with genes of people who don’t have it, we can see the difference in genes’ activity,” says Alexey Sergushichev, assistant professor at ITMO. “Based on this data, we can assume that some of the genes that act differently have an effect on the development of the disease that we’re interested in.”
Then again, a human has about 20,000 genes, and lots of them can be different in activity in people who participate in a study. So, what is the way to identify the genes that influence the development of a disease or some other condition from among the numerous “suspects”? Unless scientists find the exact genes that are related to the biological process in question, they won’t be able to find a way to correct their function. At the same time, it is not a single gene that’s responsible for a disease but rather a group of interconnected parts of a genome, which makes the task even harder.

Weight factor
Firstly, scientists identify the assumed importance of genes that operate differently: it depends on how often and how strongly the peculiarities of these genes’ functioning are present in people with the diagnosis in question. Based on this data, they can assume that the probability of some genes being connected to a disease is greater than that of others. Therefore, these genes have a higher weight factor. There are also genes with zero or even negative weight factor: this means that researchers assume or are even sure that these parts of a genome have nothing to do with the disease they study.
After they have defined the importance of every single gene, scientists can begin making a graph: genes and their interconnections that can have something to do with the disease, and interconnections between them. This task is harder than it seems, as you can’t just gather all genes with the highest weight factor into a common system and leave it at that.
“The problem is that some genes are interconnected biologically, and some aren’t,” explains Alexey Sergushichev. “Therefore, if we take all genes that we’ve considered important during the first analysis, they won’t have any connection with each other. Our goal is to find the connected ones. In most cases, we believe that there is a connection between genes if their proteins, meaning their products, interact in a cell.”

But once again, everything is not that simple. Two supposedly important genes can be connected not directly but via a third gene with a zero or even a negative weight factor, and there can be thousands of possible combinations. No person can create an active module, i.e. a precise graph that would unite the correct set of genes and their interconnections, manually. For this purpose, there exist special complex algorithms.
The issue of firm conclusions
You can create a great many graphs with supposedly important genes and their interconnections. But how to identify the one that’s the active module? The most popular approach is to compare the aggregate weight factor. This means that when the software adds a gene with a high weight factor, the aggregate importance grows. And if you need to add a gene with a negative weight factor to unite two important genes, the aggregate importance decreases. The graph with the highest aggregate weight factor is considered to be the one you’re looking for.
“On the whole, this works fine from both the scientific and application viewpoints,” comments Alexey Sergushichev, “but there’s a problem that’s been troubling us for some time. When we deem a graph an optimal one, we don’t state which of its elements we trust more and which – less. We include a gene with a negative weight factor in order to unite two important genes, but are we really sure that this gene is not important by itself? What’s more, we end up with a binary approach here: a gene is either important or not. And that’s not very good, as we still aren’t equally sure about the various elements of a graph.”

“Even from the mathematical standpoint, if we consider some range important and some not, we are most likely making a mistake somewhere,” notes Nikita Alexeev, a senior researcher and participant of the ITMO Fellowship and Professorship program. “We might say that some gene is important, and in reality, it isn’t, we might say that another is unimportant, and that is also not true. So, we want to propose a probabilistic approach that would show our level of confidence in every gene. So that we’ll see that one gene is important with a probability of 35%, another – 75%, and the third one – at 97%.”
Building a ship in a bottle
In order to solve this problem, a team of scientists from ITMO University proposed a new approach to analysing the data on the probability of connections between specific processes and genes. As opposed to creating a single graph with the highest aggregate weight factor, they decided to make hundreds and thousands of graphs with more or less high weight factors and then analyse their composition.
But there’s also a mathematical issue: how does one generate the necessary sample? How do you make enough graphs that are suitable for analysis? For this purpose, the researchers proposed a probabilistic approach, the Markov chain Monte Carlo method.
“In simple terms,” says Nikita Alexeev, “imagine that you want to build a ship in a bottle. You can try doing it with a pair of tweezers, or you can try shaking the bottle for some time. When some details have assembled themselves in a way that we want them, we fix the system in this state and then repeat the process. If we don’t like how it came out, we start the process all over. Sooner or later, if we shake the bottle long enough, we’ll have something resembling a ship. Surely, this explanation may seem kind of funny, but it captures the essence of our method. You see, we do random operations, and if it turns out the way we like it, we save that and move on; if not, we forget these results and try again."
Simply put, the scientists take a set of genes and remove one – if the aggregate weight factor grows, then everything went well and the results shall be saved. If they remove one gene and the factor diminishes, then they forego this change or try several more steps: it may well turn out that the weight factor would grow again. This way, the software creates lots of various graphs.
With such a sample, scientists can identify the genes that appear there more often than others. If a gene appears in 90% of graphs, then the scientists can be 90% sure in its connection with the condition in question.
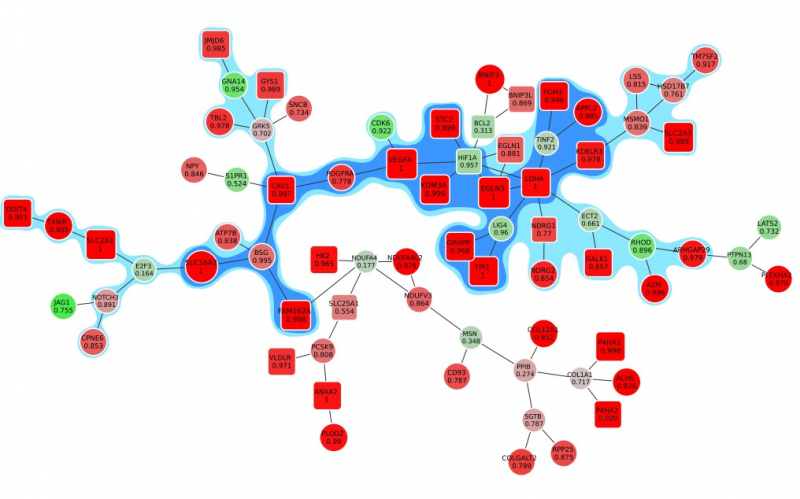
Animation: an active module of cell's reaction to hypoxia. New points, in which specialists are less confident, are gradually added to the module's core.
Presenting the results
Presenting the results in such a way that the size of the graph would reflect the margin of error turned out to be an interesting mathematical task of its own. It was important to make it so that new elements that represent genes with a lower weight factor would be added to the ones that are closest to the graph’s core, which represent the most possible originators of a biological process; at the same time, the graph shouldn’t become rearranged with every new addition so that there’s no confusion.
“In the future, it can take the form of a system with a slider that can be used to adjust the confidence scale,” explains Nikita Alexeev. “The less the confidence level, the more genes are shown. If we need a more conventional approach where we need only the genes that we are confident in, we set the confidence level of 99%, and if we need a bigger picture, even with a few mistakes, we can set it at 70%, 60% and so on.”
Reference: Nikita Alexeev, Javlon Isomurodov, Vladimir Sukhov, Gennady Korotkevich, Alexey Sergushichev. Markov chain Monte Carlo for active module identification problem. BMC Bioinformatics, 2020/